5.1 Baseline results
The performance of our forecast algorithms is summarized in Table 1 based on the relative RMSE with the random walk with drift model used as the benchmark. Firstly, for payroll tax forecasting, we find that of the models tested, AR(4) is the best across all forecast horizons, outperforming the benchmark with about a 25 per cent lower RMSE. Elastic Net is the most effective machine learning model, with an RMSE slightly higher than that of AR(4). The result implies that the autoregressive structure is the most important consideration when forecasting payroll tax revenue. Machine learning methods that explore information from the selected features are not very useful in further improving forecast accuracy. This finding is consistent with the stability of payroll tax revenue observed in Figure 1a, which implies that payroll tax revenue is less sensitive to economic fluctuations.
Turning to the prediction of land transfer duty, we observe that the random walk with drift model and the autoregressive model yield similar results. This suggests that autocorrelation in land transfer duty is not particularly useful, in contrast to payroll tax forecasting. The best-performing machine learning model, LASSO, achieves approximately a 20 per cent lower RMSE1 compared to the random walk and autoregressive models. This indicates that machine learning can enhance the accuracy of land transfer duty revenue forecasts. More specifically, regularized machine learning algorithms that are designed to reduce data dimensionality and extract useful signals from a large set of information prove particularly useful. However, it is crucial to interpret these findings with caution, as even the best performing machine learning model only marginally outperform the random walk benchmark at the 10 per cent significance level under the DM test.
Overall, our findings suggest that the efficiency of machine learning methods is associated with the nature of the tax line. Machine learning methods may not provide additional value for stable tax lines, but they can be more useful when applied to tax lines that are highly sensitive to economic fluctuations.
Table 1. Forecast performance
This table shows the performance (measured by RMSE) of 10 different methods in forecasting one- to four-step ahead payroll tax and land transfer duty revenue in Victoria.
| Payroll | Land transfer duty | |||||||
|---|---|---|---|---|---|---|---|---|
| Forest horizon | t+1 | t+2 | t+3 | t+4 | t+1 | t+2 | t+3 | t+4 |
| Random walk with drift | 1.00 | 1.00 | 1.00 | 1.00 | 1.00 | 1.00 | 1.00 | 1.00 |
| AR(4) | 0.75 | 0.67 | 0.73 | 0.99 | 1.02 | 1.07 | 1.03 | 1.08 |
| Ridge Regression | 1.60 | 1.50 | 1.45 | 2.12 | 1.22 | 1.34 | 1.17 | 1.28 |
| LASSO | 0.89 | 0.81 | 0.88 | 1.34 | 0.88 | 0.76 | 0.77 | 0.84 |
| Elastic Net | 0.95 | 0.75 | 0.86 | 1.25 | 0.88 | 0.75 | 0.76 | 0.85 |
| Gradient Boosting | 1.11 | 1.07 | 1.22 | 1.98 | 1.11 | 1.10 | 1.20 | 1.21 |
| XGBoost | 1.28 | 1.29 | 1.76 | 2.50 | 0.91 | 0.82 | 0.85 | 0.82 |
| Random Forests | 1.13 | 1.10 | 1.28 | 2.11 | 0.91 | 0.84 | 0.89 | 0.90 |
| MLP | 1.02 | 0.99 | 0.98 | 1.12 | 1.02 | 1.11 | 1.02 | 0.93 |
5.2 Where does the predictability of land transfer duty revenue come from?
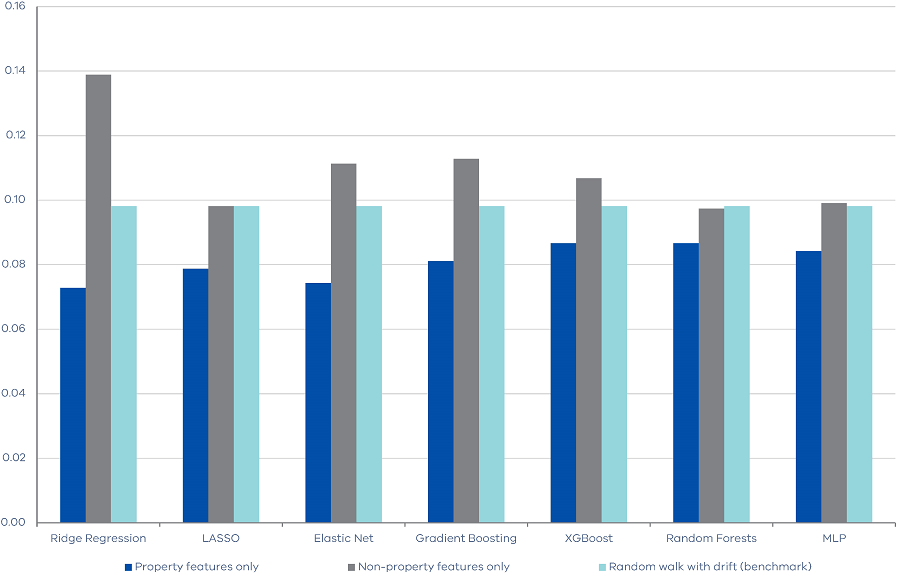
As mentioned above, our features contain property market indices from CoreLogic as well as macroeconomic indicators from the ABS. In this sub-section, we disentangle what drives the predictability of land transfer duty revenue. More specifically, we separately run the algorithms with property features only and non-property features only, then we compare them alongside with the random walk with drift method as the benchmark. This exercise focuses on one-quarter ahead forecast.
Unsurprisingly, Figure 1 shows that the property features are the more important features for land transfer duty forecasting. For example, the RMSE of Ridge Regression is 0.07 when using property features, but 0.14 when using non‑properties features. It is interesting to note that when property features are excluded, machine learning models do not outperform the simple benchmark, implying that historical macroeconomic indicators might have limited predictive power on future land transfer duty revenue. Our results also imply that machine learning algorithms are effective in identifying useful signals (i.e. property market features) from a large set of features, which might contain less useful information (i.e. macroeconomic features).
Figure 2. RMSEs of machine learning algorithms using property and non-property features
Footnotes
[1] In unreported tests, we find that our results remain robust when using the Mean Absolute Error (MAE) as the loss function.
Updated


