In this section, after discovering that machine learning techniques can be useful in forecasting land transfer duty revenue, we go deeper into assessing their performance enhancement in specific scenarios. We explore three primary directions, with a focus on:
- examining whether machine learning algorithms demonstrate improved performance when incorporating property market indices from various Australian cities in addition to Melbourne
- investigating the performance of machine learning algorithms within a data-rich environment comprising 166 features
- evaluating the performance of machine learning algorithms in forecasting during the COVID period with heightened uncertainty.
6.1 Do market conditions of other Australian large cities forecast Victorian land transfer duty?
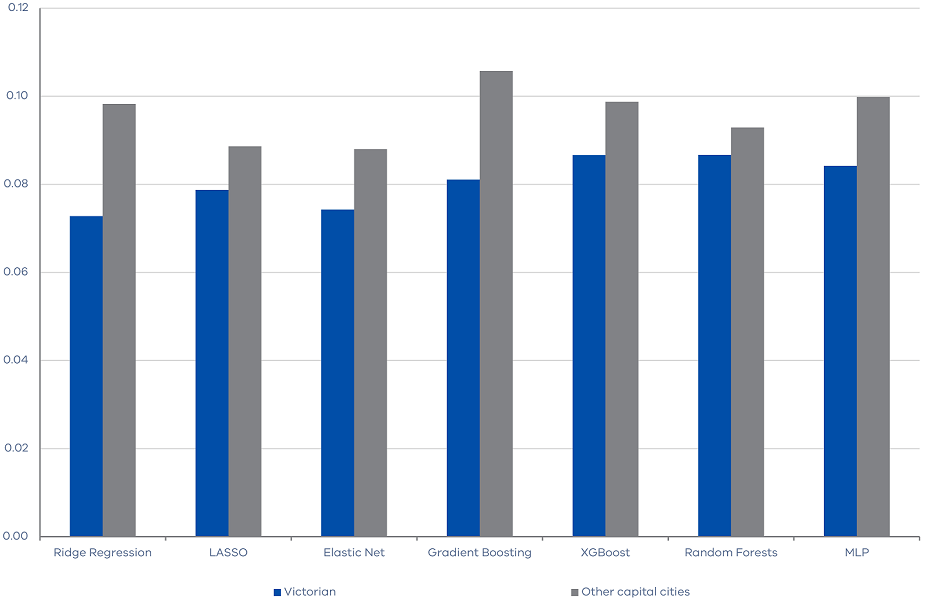
We start by investigating whether the housing market indices of other Australian large cities provide any information about the future movements of Victorian land transfer duty revenue. In particular, we include the CoreLogic housing indices for Sydney, Perth, Brisbane, and Hobart in the machine learning algorithms. Figure 3 shows that including housing market indices of other large cities does not reduce the RMSEs, suggesting that they do not provide too much additional information on the future movement of Victorian land transfer duty revenue.
Figure 3. RMSE of machine learning algorithms with other cities property features
6.2 Performance of machine learning algorithms within a data-rich environment
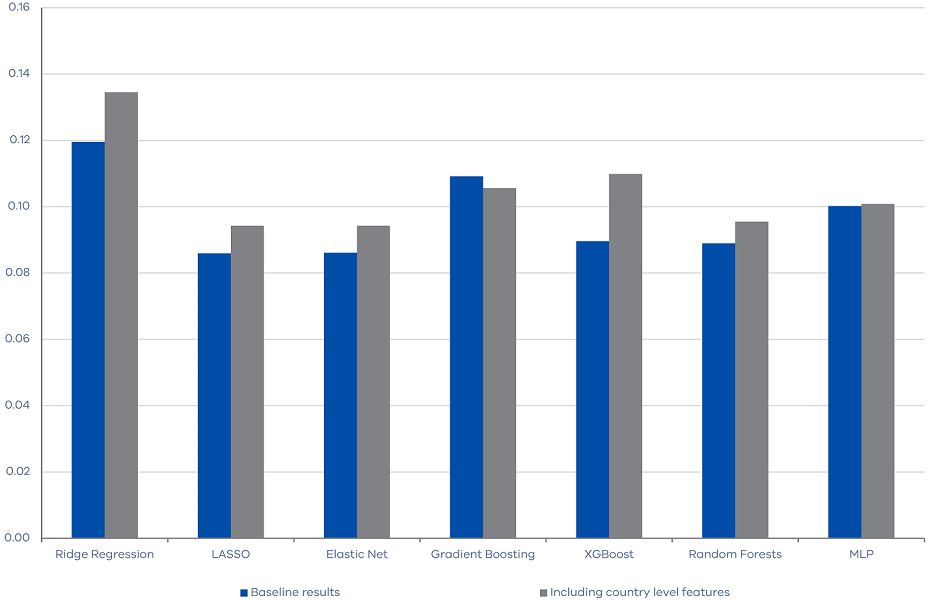
Subsequently, we expand our feature set by incorporating country-level macroeconomic variables into the original 23 features, resulting in a total of 166 features. This attempt serves two distinct purposes. First, it assesses the relevance of country-level macroeconomic conditions in the forecast of Victorian land transfer duty revenue. Moreover, it also evaluates the performance of machine learning techniques within a data-rich environment. The outcomes shown in Figure 4 indicate that the inclusion of country-level features does not lead to a reduction in forecast errors. In fact, with the expansion of the information pool, our algorithms encounter increased difficulty in discerning valuable insights, which subsequently results in slightly heightened forecasting errors in most algorithms.
Figure 4. RMSE of machine learning algorithms within a data-rich environment
6.3 Performance of machine learning algorithms during COVID
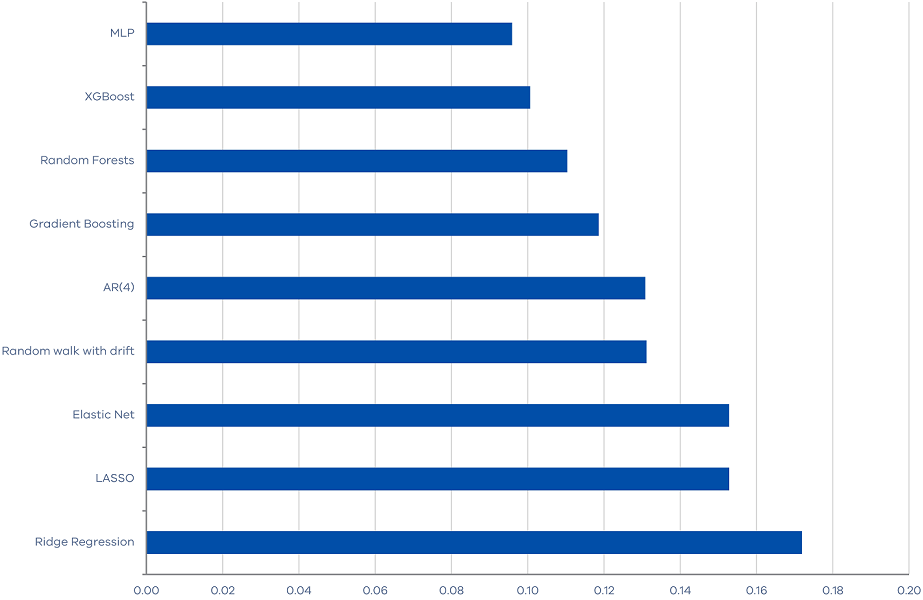
The final additional test is to evaluate the performance of machine learning algorithms during the high uncertainty period of the COVID-19 pandemic, from March 2020 to September 2022. Since this period spans only nine quarters and includes some highly extreme observations, we will simply compare the Mean Absolute Errors (MAEs) of our forecasting algorithms without commenting on the statistical significance. Also, we only include property market features which are proven the most relevant. Our results demonstrate that some machine learning methods perform quite well. In particular, the MLP neural network outperform the benchmark random walk and autoregressive models with less than 30 per cent forecast errors.
Moreover, it is interesting to note that the machine learning methods that perform well differ from those that perform well in the baseline results. In the baseline results, regularization methods perform best, implying that the strong performance of machine learning algorithms stems from their ability to reduce data dimensionality and extract useful information from a large set of features. But, these methods, such as Elastic Net, LASSO, and Ridge Regressions, are the worst performing models during the COVID-19 period when there is substantial noise in the features. Conversely, ensemble methods and neural network, such as MLP and XGBoost, which explore the non‑linear relationship between the target variable and the features, tend to perform well during the COVID-19 period.
Figure 5. MAE of machine learning algorithms for the period from March 2020 to September 2022
Updated


