These focus on which property segments dominate early data vintages and are consequently influential in the inferences relied on from analysis of the early vintages. Segments of the property market by region (inner, metro, outer, regional), by property type (houses or units) and by property value (higher or lower contract prices) are examined. The analysis then considers the impact of these vintages on a key metric often used for decision-making where the timeliness of early vintages is useful, such as the DTF HPI.
Do properties in certain regions make up more of the early data?
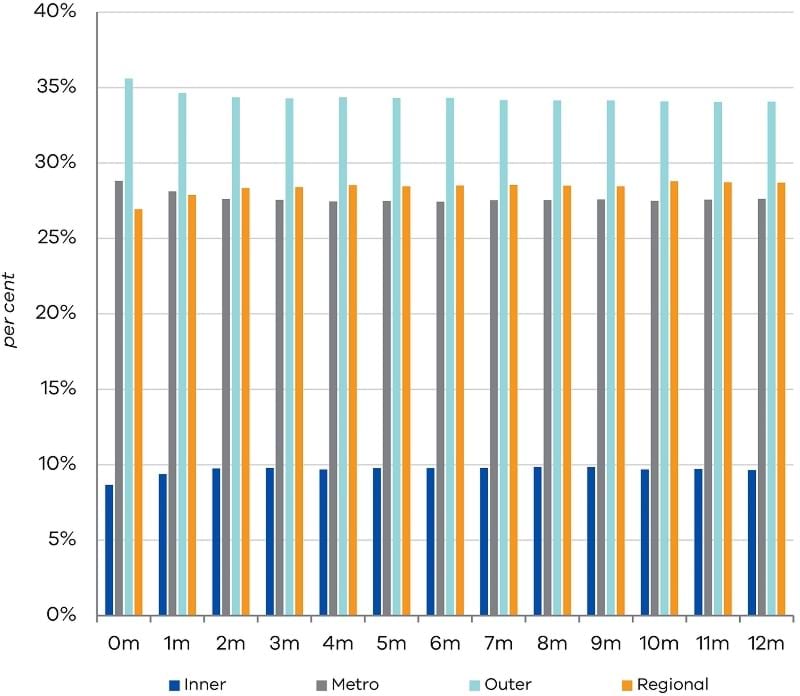
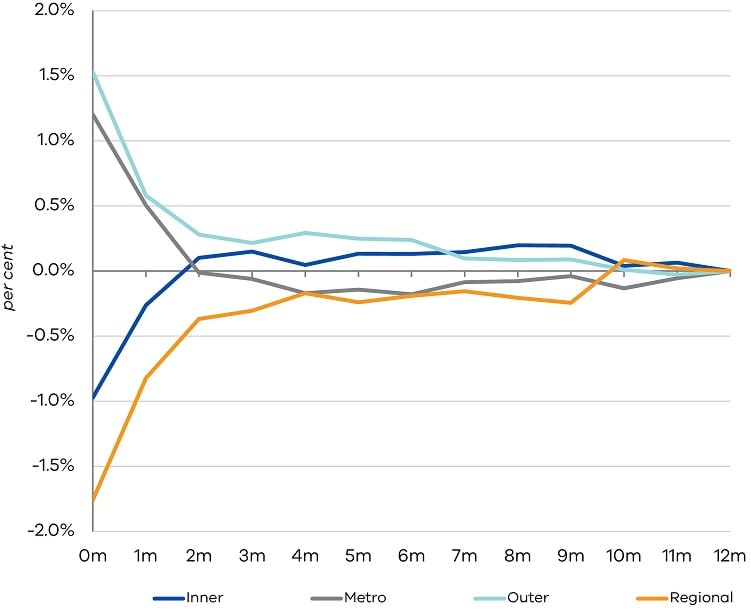
Figure 2a summarises the average share of properties that settle in the inner, metro and outer Melbourne regions and regional Victoria across vintages while Figure 2b presents the difference of these shares relative to final vintage. It was found that the inner Melbourne region makes up a smaller share of the early data vintages relative to final data vintages. On average, settled inner Melbourne property transactions make up no more than 10 per cent of total settled properties in Victoria, while Melbourne metro, outer Melbourne and regional Victoria account for between 27 and 35 per cent of total properties settled across the data vintages. Properties closer to the CBD make up a larger share of the early data vintages received. On average, the share of properties changed by just under 2 percentage points downward, in the case of inner Melbourne transactions, and upward, for regional Victoria transactions, between the first vintage and final vintage. Appendix Tables A1–A4 provide more details of these shares across the years.
Figure 2a: Average share of settled properties by regions in Victoria, across data vintages
Figure 2b: Average share differences from final vintage
Do houses or units make up more of the early data vintages?
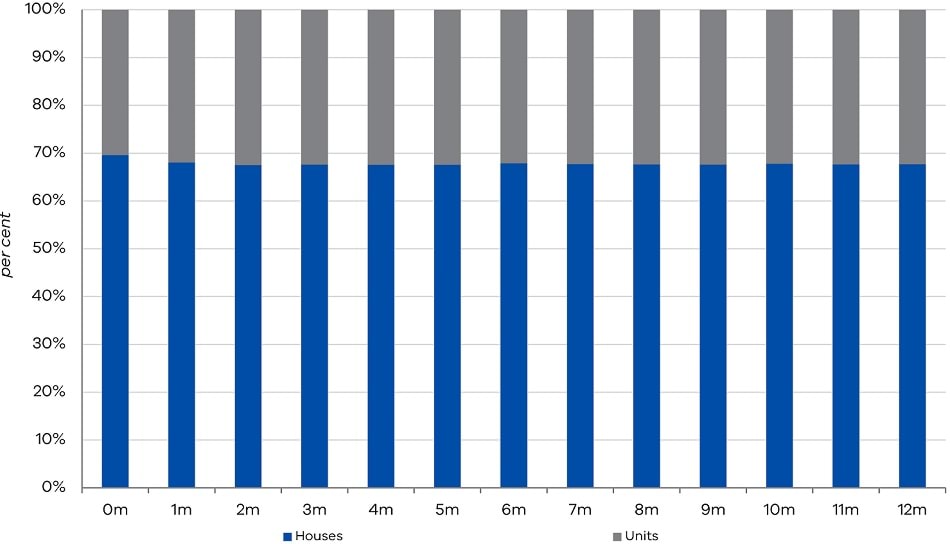
In terms of property types, houses (detached) tend to settle first compared to units (non-detached). As shown in Figure 3, the share of the houses settled is larger in earlier vintages and slowly falls. As we are only considering residential properties that are made up of either houses or units, this suggests that the share of settled unit sales increases over time (and vintages). Appendix Table A5 provides detailed values of these shares over time. On average, the share of houses in the first vintage of settled sales data is approximately 70 per cent. This decreases slightly to about 68 per cent in the final vintage.
Figure 3: Average share of settled properties by type in Victoria, across data vintages
Do higher value properties make up more of the early data vintages?
From Table 3, it appears that higher value properties are settled and recorded first. While there is some variation, as can be seen in the summary table below, the median price across vintages for the same reference period falls by the twelfth month, after the first data release. However, it is possible that this result captures in some part that houses, which are more expensive than units, settle first.
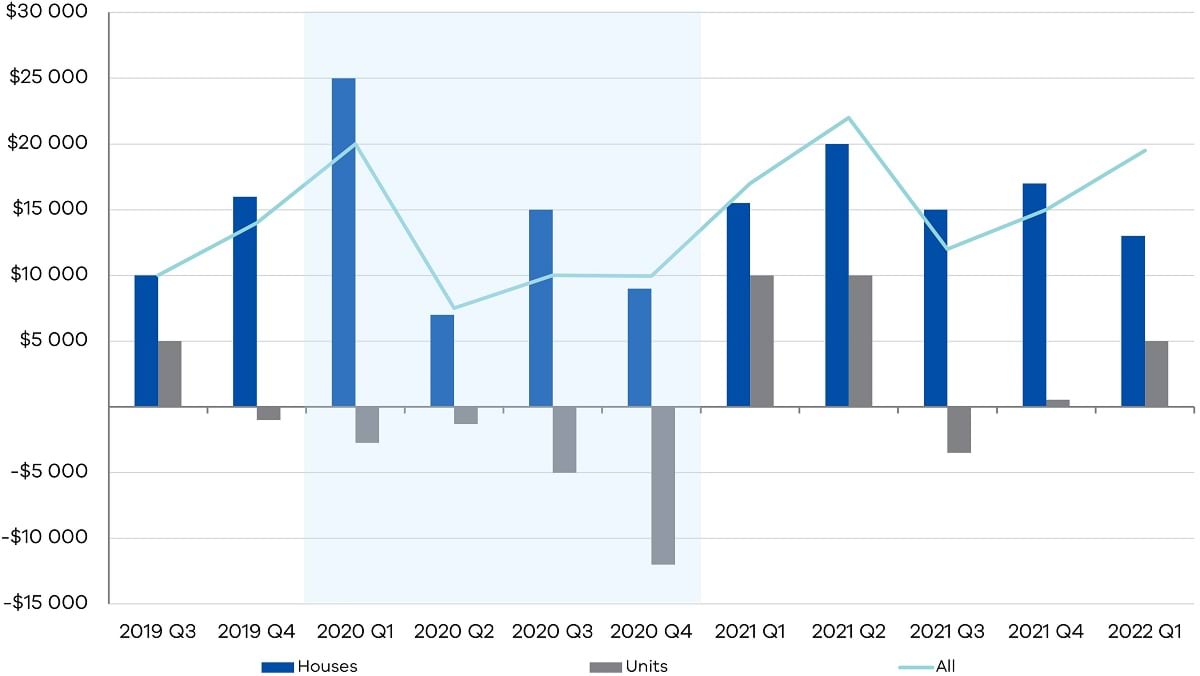
Figure 4 plots the median price of houses and units across vintages to examine this question. Across all the reference quarters, it was clear that the median price of houses transacted decreases with each additional vintage. Thus, more expensive houses settle first, on average. However, the median price of units transacted is equally likely to increase as it is to decrease between first and final vintage. Tables A6 and A7 provide greater detail of the median price changes between the 0 months ahead data vintage and the 12 months ahead data vintage for houses and units, respectively.
Table 3: Median price of settled sales transaction across vintages, by reference quarter
| 0 months ahead | 12 months ahead | |
| 2019 Q3 | $580 000 | $570 000 |
| 2019 Q4 | $615 000 | $601 000 |
| 2020 Q1 | $610 000 | $590 000 |
| 2020 Q2 | $597 500 | $590 000 |
| 2020 Q3 | $562 500 | $552 500 |
| 2020 Q4 | $629 950 | $620 000 |
| 2021 Q1 | $660 000 | $643 000 |
| 2021 Q2 | $685 000 | $663 000 |
| 2021 Q3 | $672 000 | $660 000 |
| 2021 Q4 | $730 000 | $715 000 |
| 2022 Q1 | $720 000 | $700 501 |
| 2022 Q2 | $720 000 | |
| 2022 Q3 | $685 000 | |
| 2022 Q4 | $695 500 | |
| 2023 Q1 | $680 000 |
Figure 4: Median price differences between first and final data vintage, by property type
How does the settlement lag impact on the HPI growth rate?
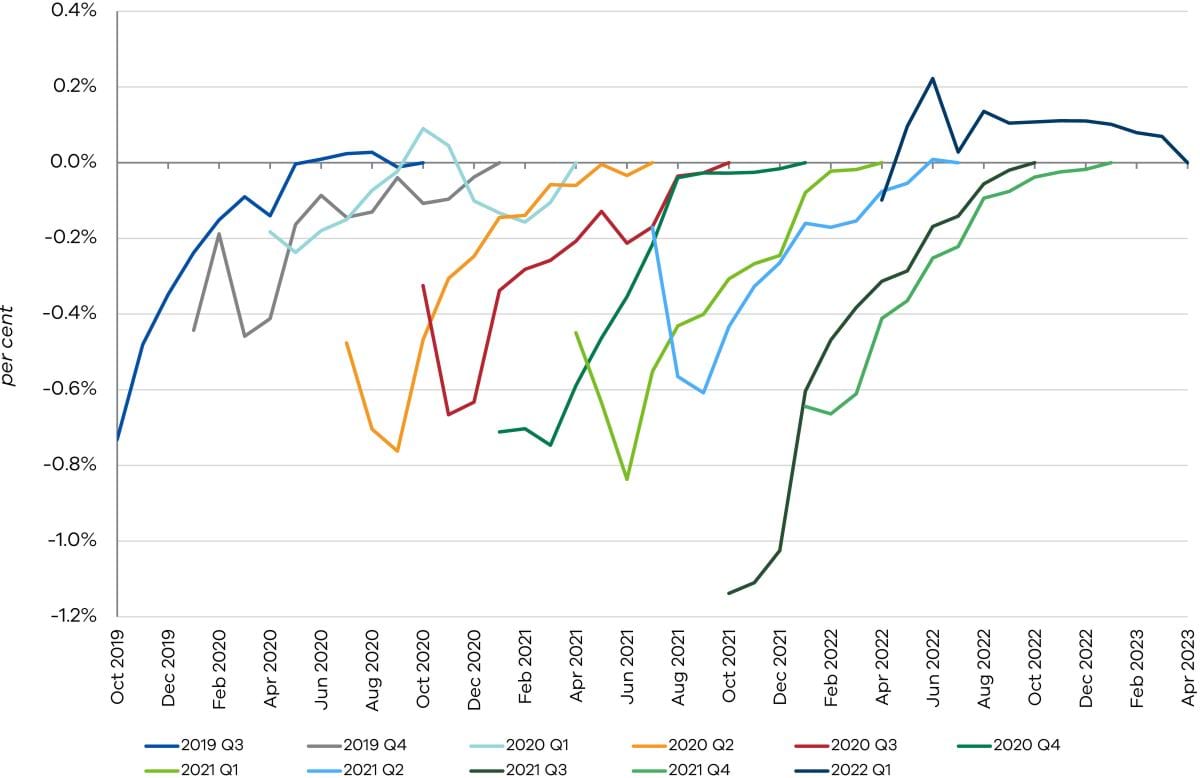
Based on the estimated HPI growth rates, the average size of the difference from final vintage (assumed to be the vintage at least 12 months from first vintage) is calculated and evaluated. We expect that the earlier estimates would be different to later estimates, since there is incomplete data being used in the early stages. We further expect that the size of these differences will shrink as the vintages used to determine the values approach final vintage. Figure 5 summarises the through‑the‑year growth rate differences for each reference quarter across vintages relative to the final through-the-year growth rate. For most of these reference quarters, the estimated growth rate increases as more settled sales data is received.
Figure 5: Evolution of through-the-year growth estimate difference from the final estimate across vintages, by reference quarter
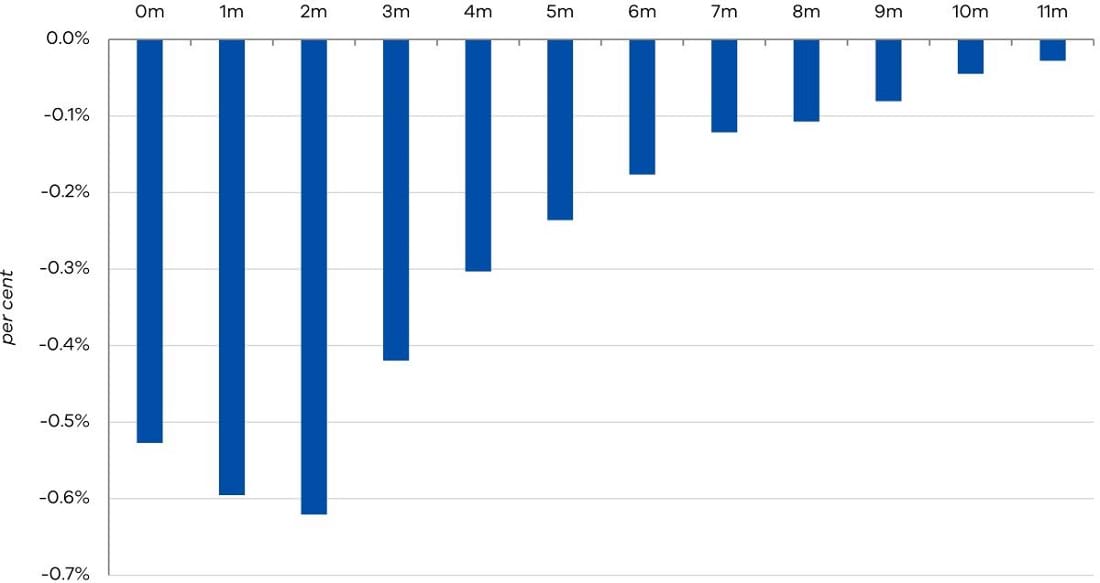
Figure 6 charts the average differences between the HPI growth rate values (based on the reference period’s first 11 vintages) and the corresponding HPI values (based on final data vintage). We can see that the average size of these differences ranges from 0.03 percentage points to 0.62 percentage points. This means that over the period analysed, the HPI growth rate was revised upward as a result of the additional settled sales data received. The biggest difference in the calculated early vintage and final vintage HPI values is surprisingly not found in the first (0 months ahead) or second (1 month ahead) vintages, but rather is in the third vintage (2 months ahead). But as expected, the size of this difference falls to less than 0.1 percentage points by the ninth vintage (8 months ahead).
Figure 6: Average size of difference from final vintage estimate of HPI through-the-year growth
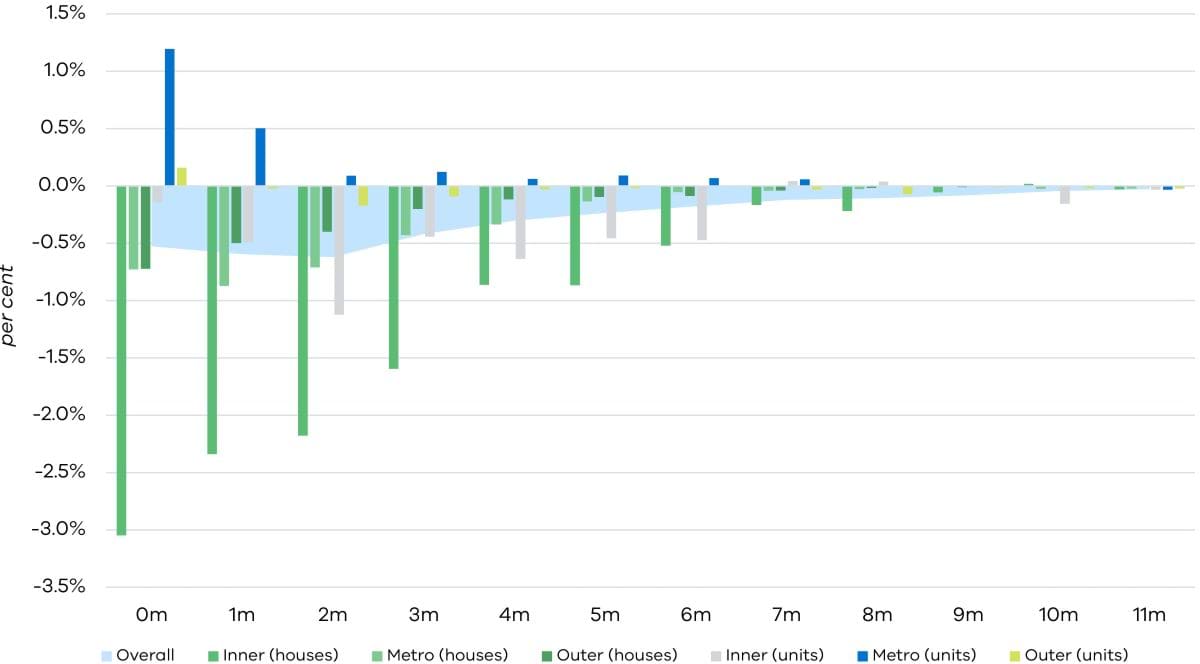
Figure 7 breaks down these HPI estimate differences by region and dwelling type, with some interesting results. We find that early estimates of price growth for inner Melbourne houses require the largest upward revisions compared to other property types. The required growth rate adjustment can be as much as 3 percentage points to match the final vintage values. This large gap appears to persist well into the 7th vintage (6 months ahead). Metro and outer Melbourne houses also need some upward adjustment, but only by up to 0.9 percentage points. This difference is seen to dissipate quickly over the early data vintages.
Figure 7: Average size of difference of estimate of HPI through-the-year growth rate from final estimate
Price growth estimates for units show a different trend altogether, particularly for metro Melbourne units. We find that early vintage data for units or apartments in metro Melbourne indicate a house price growth that is 1.2 percentage points higher than the price estimates gathered from the final vintage data. However, this difference drops quickly to around 0.5 percentage points difference by the second vintage (1 month ahead) and disappears altogether by the fifth vintage (4 months ahead). Appendix Table A8 and A9 provide more growth rate details across the reference quarters.
The average size of the difference is less than 1 full percentage point in growth. The only differences larger than this were found in the inner and metro regions, for both houses and units. This suggests that while only about 60 per cent of final vintage settled sales data is received in the first vintage on average, this partial dataset contains sufficient information to be representative of the final vintage data and inferences made when analysing the overall index.
Updated


